Keith Bryant, Global Director of Electronic Sales, Yxlon International, Hamburg, Germany
Within electronics manufacturing and failure analysis inspection, 2D inspection is the primary method of X-ray inspection and, traditionally, systems were only offering this. CT or 3D then became an option and quality varied dramatically depending on many factors including quality of image, stability of X-ray tube, reconstruction software, computing power, etc. It took a long time to make a 3D image, and getting detailed images could take many hours. This made it something that had very little use in the real world of manufacturing.
However, due to the design of the systems and the technology used, the biggest issue with CT was that that sample size was roughly the dimension of a business card. This was because of the simple fact that to get good magnification the sample had to be close to the X-ray tube and to build the CT image the sample had to be rotated within the beam of the X-ray tube.

Figure 1. Conventional CT X-ray layout.
Cone beam technology is standard in the machines used for electronics inspection. The tube is at the bottom of the system, with the sample held by some form of manipulator and a collector at the top of the system, or the other way around in some systems. However, this can cause issues with the sample colliding with the tube. So, in this type of system CT is normally a failure analysis technique, unless working at the component level.
Inclined or partial CT
Partial CT is a quite recent technology, and the main benefit is that it works by focussing on an area of interest on an assembly or product, the only size limit is the inspection area of the system. The area of interest is set within the X-ray cone beam and the sample or the detector is rotated.

Figure 2. ICT manipulation
A larger number of images are taken, for instance one every degree, and these are then processed to make several slices. This allows the operator to drill down through the number of slices to check interfaces and other key areas within the images.

Figure 3. ICT slice showing QFN interface.
However, as the captured images are taken at an angle and not by rotating the sample 360° within the beam some data is missing. This means that when the 3D reconstruction is done it is not accurate in some areas because the data is incomplete. To overcome this, some systems guestimate what should be there, making the image look more real but may not be accurate.

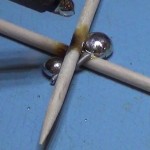
Figure 4. BGA balls showing lack of data.
The figure above shows a section through some BGA balls. Where the cross section is taken, the 3D reconstructed image is accurate but the pointed area of the balls is inaccurate and results from the lack of gathered data in this area.
CROSSOVER SYSTEMS Background
The lines between NDT and electronics X-ray inspection have become blurred as smaller features need to be seen in NDT and assembled product CT is being requested by more and more electronics manufacturing companies.
This has led to the development of more flexible platforms that can cope with sub-micron demands and large field of view applications. Certain key features are required to give a system the ability to perform well in both arenas.

Figure 5. Crossover System.
A very stable base is needed for the key components (tube, manipulator and detector), and so granite typically is used for this. It also requires very accurate motion systems, with encoder modules made by top-quality manufacturers. Rotation tables are very high precision with high-end air bearings, resulting in accurate, repeatable results.

Figure 6. Air bearing rotation table
The higher-powered X-ray tubes also tend to be water cooled with diamond targets to give stable performance for demanding applications and over longer scanning times.
In order to work at the nano and sub-micron level and to image larger demanding applications, it is typical for these systems to have two tube types. This can add to the time needed, however, some systems can change tubes at the touch of a button. Even keeping the same focus region when the tubes are changed is a significant advantage.

Figure 7. Image showing two X-ray tubes inside.
These systems also tend to be larger than the normal offline ones generally seen in our industry. The larger and heavier sample sizes and the larger flat panel detectors partly are due to the horizontal, rather than vertical, configuration.
NEW TECHNOLOGIES Helical scanning
To increase the field of view but maintain high magnification, helical scanning is used, as well as very accurate manipulation and very clever software is needed to control the technology. The tube and the detector rise together, allowing the field of view to move up the sample, producing very detailed large images.
The other alternative is to use stitching to join several smaller images together and produce one large image but the accuracy is poor by comparison.

Figure 8. Image showing helical scanning layout
This allows very detailed images of larger objects to be made as the smart phone below illustrates.

Figure 9. Smart phone imaged in a single shot
Virtual Rotation Access
This is a software-driven technology that allows operators to select a field of view not in the centre of the rotation table.

Figure 10. Image showing virtual rotation in action
It is ideal for hard-to-hold samples or to make several 3D images without repositioning the sample multiple times to make the optimum image.

Figure 11a. full 3D image of bracket

Figure 11b. 3D image of mounting hole made by virtual rotation.
Anti-collision systems
The potential for collision and damage increases when working with large samples or with those that are offset or held at an angle. The more sophisticated systems use a camera and specific software to check the sample position during rotation. This allows the operator to set the sample close to the tube, magnifying the image without the potential for damage.

Figure 12. Camera action for collision prevention
Remote Monitoring and Push Messages
This software innovation allows operators to manage one or more systems remotely. Continuous communication of inspection progress and health data gives operators complete control. It displays the system health monitor, real-time information and alerts. The software works on all Windows tablets and PCs, and it allows remote monitoring by sending push messages or calling the user for direct system interaction.

Figure 13. System remote monitor
METROLOGY
Traditional X-ray systems have struggled with measurement accuracy and repeatability because basically they were microscope-based and not measurement systems. Crossover systems have much more accurate components and active vibration damping, making them metrology-based.
The better machines have calibration values related to the PTB-certified measurement sphere gauge in a controlled environment at 20°C ±0.5°. Some companies offer guaranteed PTB values for a delivered system that can be ordered as optional feature.

Figure 14. Actual to nominal comparison measurement of component
CT IMAGES FROM HIGH-END SYSTEMS
Below are some images demonstrating the capability of Crossover systems. From sub-micron to full assemblies, the images show features that are challenging, such as dendrites a few microns in diameter and those that are hard to see even with high-end 2D systems.

Figure 15. dendrites 5 m

Figure 16. copper pillars

Figure 17. 30 m balls

Figure 18. 12mm copper pillars

Figure 19. Relay assembly

Figure 20.15mm copper wires


NEWSLETTER


Views


Skyscraper 1