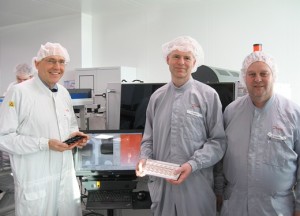
Lauri Märtin, SMA Engineer, Enics Eesti AS;
Kristjan Piir, Manufacturing Technology Manager, Enics Eesti AS.
Keith Bryant, X-ray Sales Director, Yxlon International GmbH
INTRODUCTION
Enics with world-class electronics manufacturing services is the partner of choice for many global electronics companies. As one of the largest EMS providers in the world, they supply customers in the fields of transportation, building automation, energy, industrial automation and instrumentation. Helping them to optimize their value chains and improve their competitiveness.
The engineers responsible for Product Introduction always try to get the customer design to a standard that allows for high yield in production. However sometimes the design is fixed, the boards purchased already or there is another reason why the board has to be built as is.
In these cases, redesigning key stencil apertures or modifying other process parameters can make the difference between a low quality and expensive result and a high level first time pass rate and a cost effective build.
These engineers noticed that despite making improvements in many areas the production yields were often lower than anticipated. So they started to use their 2D off line x-ray system to check the paste after component placement on the pre-production runs, instead of using it as an AQL tool and for checking production ‘first offs’.
By checking the solder paste dimensions and shape after component placement and then checking the finished boards for solder balls, solder joint quality and voiding levels were compared to the solder paste. Correlation was found between instances of poor quality and paste shape and volume. So changes were made so that any problems could be addressed before putting the job into production. Quality was now built into the product at the start rather than bad boards inspected out and reworked to achieve acceptable results.
This has led to significant improvements in yield, reduced rework and scrap, proving that the methodology of this procedure offered significant process improvements.
RESULTS
The most accurate way of measuring the success or failure of this type of experiment is to monitor the change in first time pass results on a production line. Figure 20 shows the results over a 16 week period while the improved design apertures were implemented into main line production.
The best unit of measurement of this type of result is DPMO, Defects Per Million Opportunities. It is a tougher and more realistic methodology the Parts Per Million
Note that DPMO differs from reporting defective parts per million (PPM) in that it comprehends the possibility that a unit under inspection may be found to have multiple defects of the same type or may have multiple types of defects. Identifying specific opportunities for defects
Contrasting those results before the changes in aperture design were implemented with the results seen after the new stencil with the improved apertures was put into the printer and used for the production run.
The changes in aperture design were done in two stages, stage 1 in week number 42
Against a target of 150 DMPO the line had been running at around 750 per week average or 5 times the target. After implementation of the improved stencil the DMPO figures were much closer to the target.
When the second stage of improvements was implemented in Week number 46 a further drop in end of line failures was seen. This shows a huge and consistent quality improvement for an investment of Engineering time and a few stencils which is a great Return On Investment!
ACKNOWLEDGEMENTS
The authors would like to thank the following for their support in producing this paper:
P Zarrow, ITM Consulting
R Willis, EPS Services
A Weldon, TW Consulting
Views
Skyscraper 1
